Table of Contents
- Summary
- Progress so far
- Energy Use
- Water Use
- Waste & Waste minimisation
- Transport
- Streamlined energy and carbon reporting for college corporations
Summary
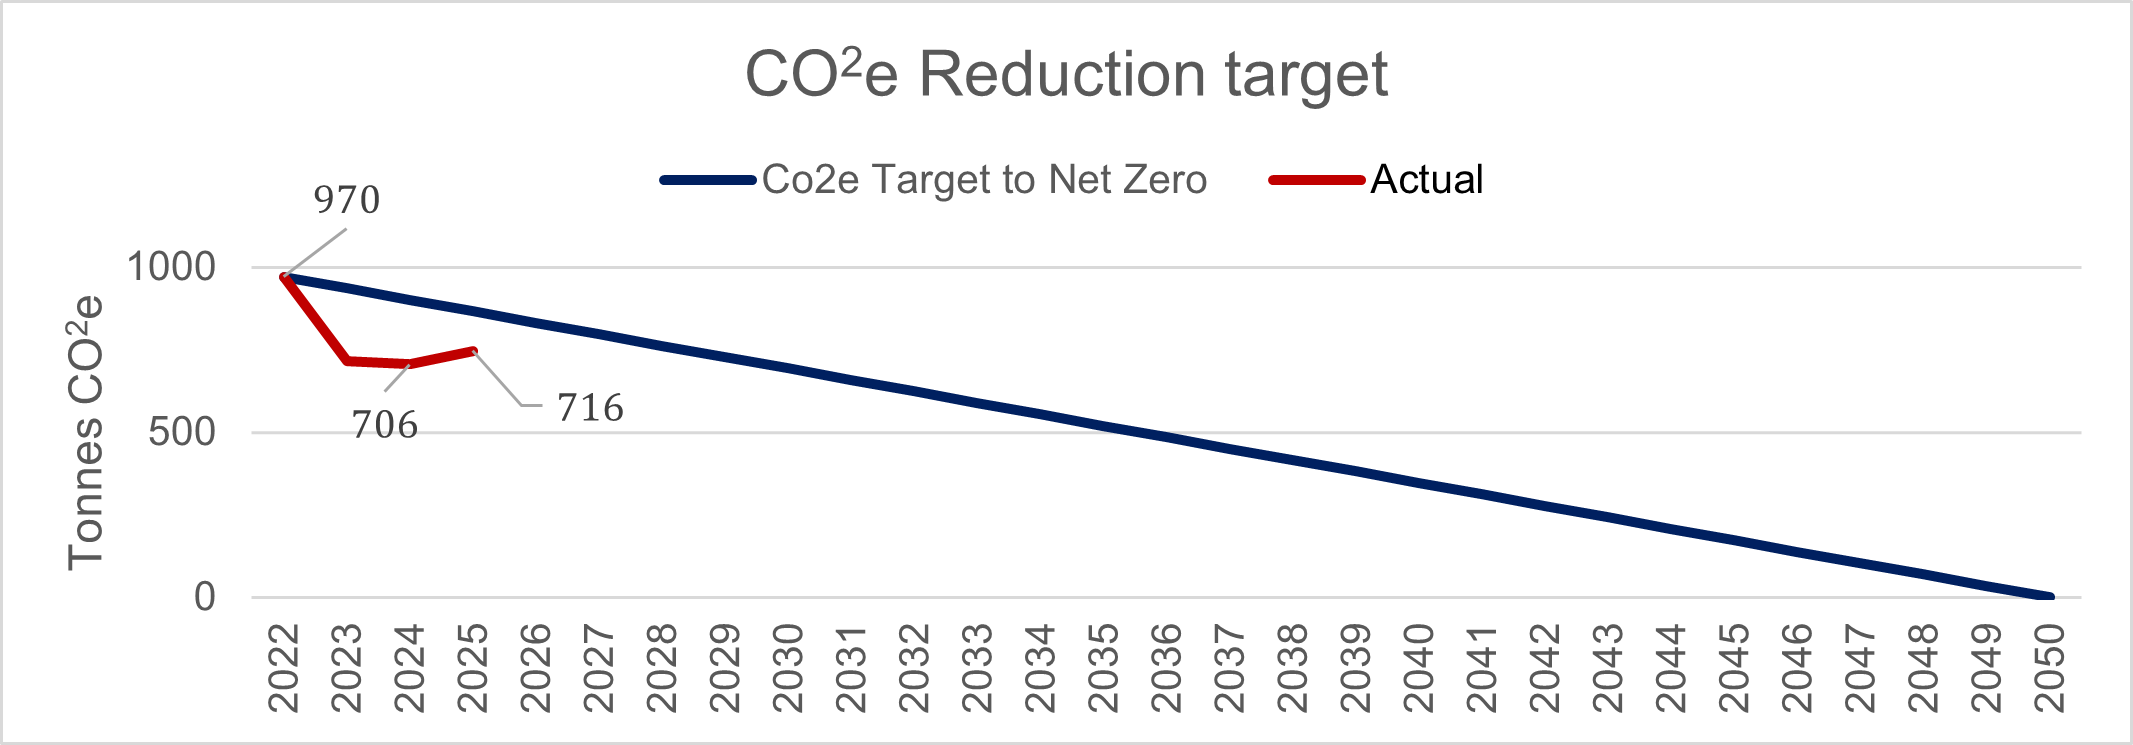
- This report covers the reporting period from 1 August 2024 to 31 July 2025. The College remains committed to reducing the environmental impacts of our operations and during 2024 formally adopted the target of achieving net carbon zero by 2050. We continue to set specific objectives and goals in order to improve our environmental performance. This report sets out initial performance benchmarks and actions underway to monitor and improve the environmental impacts of our operations..
- Due to the impact of lockdowns during the covid pandemic in 2019/20 and 2020/21, we have used 2021/22 as our “baseline” year for monitoring our carbon reduction performance on our journey to Net Zero. Our performance so far is summarised in the chart below:
- The college’s historic Scope 1 (Gas) and Scope 2 (Electricity) energy use since August 2015 is summarised below.
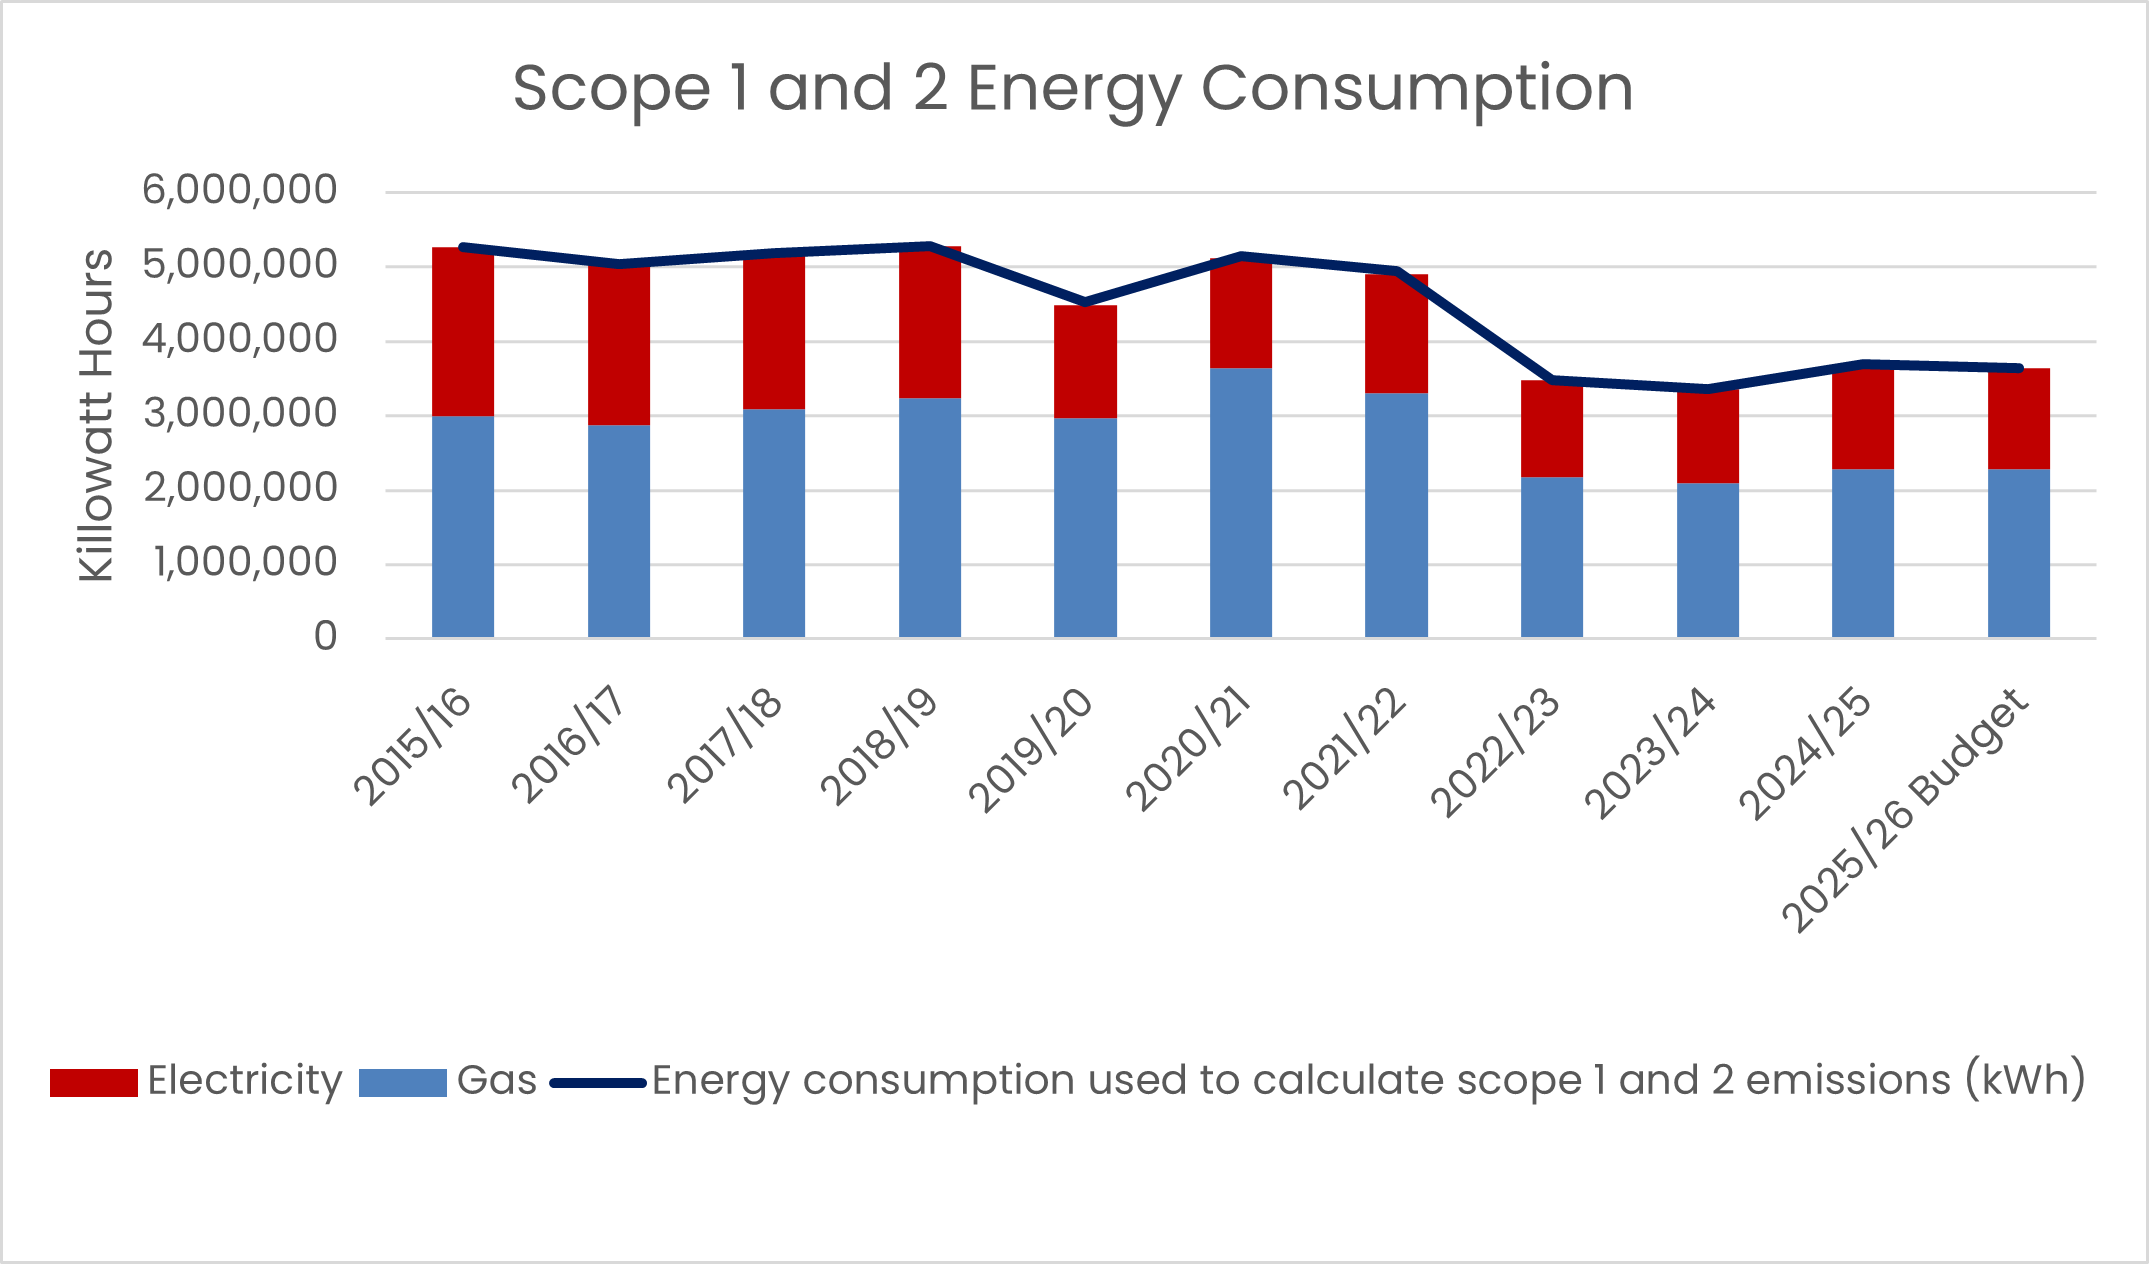
The energy used by the college over this period has been accompanied substantial growth in student numbers at the college with corresponding intensity of use of the college’s facilities and estate.
Progress so far:
- Since 2018, when the college started actively focusing on the sustainability of its operations, the college has undertaken a number of initiatives to deliver improvements as follows:
- Installation of improved energy efficient LED lighting across all campuses starting with the London Road campus in 2018/19, following which a programme of replacement of old lighting systems with LED lighting has been rolled out at all campuses which was completed in 2023/24.
- Active monitoring of base load electricity consumption to identify and eliminate waste was undertaken in 2020. The college subsequently installed active electrical energy monitoring in 2023 across its London Road campus to more effectively monitor and identify further opportunities for reduction in use.
- Elimination of single use plastics within its canteens and introduction of compostable alternatives.
- Substantial upgrades at the London Road campus in 2020 further improved efficiency of heating systems. This was complemented by Installation of Solar Panels in January 2022 and Voltage Reduction equipment installed at the three campuses in December 2022 and February 2023 to further reduce electrical consumption and corresponding carbon emissions.
- Substantial Building fabric improvements were undertaken in 2021 with the renewal and upgrade of windows in the Performing Arts block at London Road campus and in 2022 to replace single glazed windows in the Main Block, also at London Road. The college commissioned and developed Heat decarbonisation plans for buildings with old gas-based heating systems and developed detailed designs for Heat decarbonisation of buildings at the English Bridge and London Road campuses. The age and fabric of existing buildings however means that further improvements to the fabric of its buildings is required before any transition to non-gas based heating alternatives can be achieved. Substantial additional grant funding will be required in order for such improvements and a subsequent transition to non-gas heating systems to be affordable.
- In 2024-25 eight electric vehicle charging points were installed to enable staff, students and the public (at appropriate times) to charge their electric vehicles. This infrastructure is intended to support the transition to electric vehicles.
- Goals 2023 to 2024
- Continue to review and develop long term plans for further Solar electricity production capacity.
- Continue staff and student engagement to raise awareness and engagement in sustainability activities and sustainable behaviours.
- Continue to improve monitoring and management of energy use on all campuses.
- Focus on more active management of water consumption and leak identification.
- Goals 2023 to 2024
Energy Use
Annual Electricity consumption
- The tables below set out the past nine years' annual electricity consumption, as measured by KWh usage, CO2e emissions and KWh per m2 used. The data is taken from the historic half hourly meter readings on each of the College’s campus sites.
Electricity | Campus | |||||
London Road | English Bridge | Welsh Bridge | Total | Total | ||
Academic Year | KWh used | KWh used | KWh used | KWh used | CO2e emissions (t) | |
15/16 | 1,594,738 | 306,514 | 363,549 | 2,264,801 | 1046 | |
16/17 | 1,558,571 | 250,178 | 354,863 | 2,163,612 | 891 | |
17/18 | 1,501,099 | 295,692 | 303,782 | 2,100,574 | 739 | |
18/19 | 1,470,657 | 286,709 | 287,380 | 2,044,746 | 575 | |
19/20 | 1,055,099 | 223,931 | 234,605 | 1,513,636. | 387 | |
20/21 | 1,004,891 | 236,891 | 241,483 | 1,483,264 | 311 | |
21/22 | 1,080,954 | 264,463 | 253,374 | 1,598,791 | 336 | |
22/23 | 869,777 | 224,702 | 214,636 | 1,309114 | 253 | |
23/24 | 856,558 | 217,636 | 191,476 | 1,265,670 | 262 | |
KWh per m2 used | ||||||
15/16 | 89 | 37 | 70 | |||
16/17 | 87 | 30 | 68 | |||
17/18 | 84 | 36 | 58 | |||
18/19 | 82 | 35 | 55 | |||
19/20 | 59 | 27 | 45 | |||
20/21 | 56 | 29 | 46 | |||
21/22 | 63 | 32 | 49 | |||
22/23 | 49 | 27 | 41 | |||
23/24 | 48 | 26 | 37 | |||
GIA 22/23 | 17,924 | 8,236 | 5,204 | |||
GIA = Gross Internal Area m2
Consumption in 2019/20 and 2020/21 was reduced by the Covid pandemic lockdowns, significant reductions have been achieved on all campuses since 2021 as the result of measures outlined above and in particular by the introduction of new solar panels at the London Road campus in January 2022. Voltage optimisers were installed in 2023 at all three sites to further reduce consumption.
Continued monitoring remains in force following the introduction of power management system (Clear Vue) at London Road, identifying when there are unexpected surges in usage allowing management to react and rectify in a timely manner.
Annual Gas Consumption
Gas is used to supply heating and hot water at all three campuses. Gas demand is driven primarily by outside temperatures. The differing thermal efficiencies of the buildings at each campus primarily drive the amount of heating and gas consumption required. The London Road campus has a Building Energy Management system designed to control manage and monitor heating in several buildings. Use of such BEM systems are estimated to reduce overall gas usage. The age and condition of existing heating systems at the English Bridge and Welsh Bridge mean that installation of equivalent BMS systems at these campuses is not currently considered practical. Alternative mechanisms for enabling improved regulation of heating will be kept under review and implemented as practicable.
The tables below set out the past nine years annual gas consumption, as measured by KWh usage, CO2e emissions and KWh per m2 used. The. The data is taken from the historic meter readings on each of the College’s campus sites.
Gas
Campus
London Road
English Bridge
Welsh Bridge
Total
Total
Academic Year
KWh used
KWh used
KWh used
KWh used
CO2e emissions (t)
15/16
1,897,040
555,390
549,002
3,001,432
552
16/17
1,868,148
526,039
475,659
2,869,846
528
17/18
2,023,711
602,633
458,134
3,084,478
568
18/19
2,162,152
631,907
445,588
3,239,647
596
19/20
2,238,606
656,876
406,586
3,302,068
608
20/21
2,550,008
626,716
462,501
3,639,225
669
21/22
2,173,211
742,159
383,861
3,299,231
603
22/23
1,431,617
491,211
247,142
2,169,971
397
23/24
1,308,521
474,346
305,313
2,088,179
384
24/25
1,349,711
630,288
272,498
2,252,497
411
KWh per m2 used
15/16
106
67
105
16/17
104
64
91
17/18
113
73
88
18/19
121
77
86
19/20
125
80
78
20/21
142
76
89
21/22
121
90
74
22/23
80
60
47
23/24
73
58
59
24/25
75
77
52
GIA 22/23
17,994
8,236
5,204
- Consumption in 2020/21 was particularly high due to the requirements to ensure high ventilation in rooms to help reduce transmission during the covid pandemic and yet try to maintain thermal comfort for students and staff. Significant reductions have been achieved on all campuses since 2021/22 as the result of measures outlined above and in particular by the introduction of new double glazing at the London Road campus in July and August 2022. In addition, starting in 2021/22 the College actively reviewed the use and timing of heating of its campus buildings in response to external temperatures and staff and student feedback to reduce the amount of gas used.
Water Use
- Water is a precious resource and clean, drinking water is both energy and chemical intensive in its production and supply. Water use is primarily people related with most water being used in toilet and cooking facilities. At the London Road campus, water is also consumed by the Sports Centre changing facilities and other curriculum areas such as sports, hair and beauty and brickwork. At the English and Welsh Bridge campuses water is only used primarily for toilet and cooking facilities.
- The table below set out the past six year’s annual water consumption. The data is taken from the historic readings on each of the College’s campus sites.
- There was a major leak at London Road in December 2021 that affected consumption at London Road.
Water | Campus | |||||
London Road | English Bridge | Welsh Bridge | Total | Total | ||
Academic Year | M3 used | M3 used | M3 used | M3 used | CO2e emissions (t) | |
15/16 | 4,664 | 2,724 | - | 7,388* | 2.54* | |
16/17 | 6,803 | 2,809 | - | 9,612* | 3.31* | |
17/18 | 5,585 | 2,340 | 1,138 | 9,063 | 3.12 | |
18/19 | 5,761 | 2,410 | 1,067 | 9,238 | 3.18 | |
19/20 | 4,379 | 2,050 | 691 | 7,120 | 2.45 | |
20/21 | 9,125 | 1,774 | 559 | 11,458 | 1.70 | |
21/22** | 23,793 | 1,744 | 974 | 26,511 | 3.95 | |
22/23 | 13,107 | 3,073 | 1,050 | 17,230 | 2.57 | |
23/24 | 10,437 | 1,939 | 1,049 | 13,426 | 2.01 | |
24/25 | 10,891 | 1,869 | 1,599 | 14,358 | 2.74 | |
* - Welsh Bridge meter readings data for 15/16 and 16/17 are not reliable or consistent and have been excluded.
** - London Road consumption for 21/22 and 22/23 is inflated by a major pipe leak which occurred underneath a building and so did not become immediately apparent.
Waste & Waste minimisation
- The College recognises the importance of the UK Government’s waste hierarchy, namely ‘reduce, reuse, and recycle’. The College is committed to disposing of materials in an environmentally sensitive manner and encouraging the reuse and recycling of waste materials where possible. However, the minimisation of wastes produced is the first priority.
- Since 1 April 2021 the College’s waste is disposed of by Veolia, who have recently invested in a new disposal facility in Shrewsbury, with the additional benefit of reducing transport mileage to and from the college and the disposal site. Veolia transports solid waste to specialised sorting centres. Waste resulting from the selective collection of commercial waste and non-hazardous industrial and commercial waste is sent to high performance sorting centres managed by Veolia. Specialised processes, such as auto-adaptive sequential sorting (TS2A), are used to achieve recovery rates of up to 95%. The recovered waste then becomes secondary raw materials for industry. Veolia also separates and recycles complex waste, such as batteries and electronic cards.
- Non-recyclable non-hazardous waste is estimated to be 60% of the waste stream that is transported to incineration plants. 100% of the waste has been diverted from landfills. 92.63% has been recycled. The incineration process produces energy in the form of steam which is converted into electricity and fed into the national grid distribution network. Veolia also captures gas generated by the fermentation of organic waste in its landfills. This biogas is then directly delivered to a distribution network, used to produce electricity through turbines or engines, or used as fuel for vehicles.
- Specialist wastes (e.g. building waste, metals etc.) are stored and disposed of separately through appropriate routes. e.g. Metal waste is sold to scrap metal merchants for re-use.
- During 2023-24 London Road campus waste streams were as follows:
Material | Proportion | Weight: Tonnes |
Commercial | 33.0% | 58.3 |
General Construction Waste | 46.9% | 82.8 |
Paper & Cardboard | 9.0% | 15.9 |
Food Waste | 5.4% | 9.6 |
Tyres | 0.5% | 0.9 |
Plasterboard | 4.5% | 7.9 |
Glass | 0.7% | 1.3 |
Grand Total | 100% | 176.7 |
- Waste streams from English Bridge campus are measured and reported by Veolia. The table below shows the total waste by type for English Bridge.
Material | Proportion | Weight: Tonnes |
General Waste | 84.4% | 12.6 |
General Construction Waste | 15.6% | 2.3 |
Grand Total | 100% | 14.9 |
- Waste streams from Welsh Bridge Campus are measured and reported by Veolia. The table below shows the total waste by type for Welsh Bridge.
Material | Proportion | Weight: Tonnes |
General Waste | 65.9% | 7.7 |
Mixed Recycling | 34.1% | 4.0 |
Grand Total | 100% | 11.7 |
Transport
In 2024-25 staff travelled 93,758 miles on college business and College minibuses and other vehicles travelled 38,011 miles. This equates to the following CO2 emissions.
CO2e emissions (t) | |
Business travel in employee-owned vehicles | 48.75 |
Owned transport | 12.43 |
Streamlined energy and carbon reporting for college corporations.
The following table summarises the College’s annual UK energy use (in KWh) relating to gas, purchased electricity and transport fuel and the associated greenhouse gas emissions (in tonnes of carbon dioxide equivalent (CO2e))
Greenhouse gas emissions and energy use data for the period 1 August 2023 to 31 July 2024 – UK | 2024/25 |
Energy consumption used to calculate emissions (kWh) | 3,353,909 |
Energy consumption break down (kWh) (optional): | |
Gas | 2,252,497 |
Electricity | 1,377,506 |
Transport fuel | 61.18 |
Scope 1 emissions in metric tonnes CO2e | |
Gas consumption | 411 |
Owned transport | 12 |
Total scope 1 | 423 |
Scope 2 emissions in metric tonnes CO2e | |
Purchased electricity | 244 |
Scope 3 emissions in metric tonnes CO2e | |
Business travel in employee-owned vehicles | 49 |
Total gross emissions in metric tonnes CO2e | 716 |
Intensity ratio | |
Tonnes CO2e per member of staff | 1.12 |
We have followed the 2020 HM Government Environmental Reporting Guidelines. We have also used the GHG Reporting Protocol – Corporate Standard and have used the 2021 UK Government’s Conversion Factors for Company Reporting.
Intensity measurement
The chosen intensity measurement ratio is total gross emissions in metric tonnes CO2e per staff member, the recommended ratio for the sector. Measures taken to improve energy efficiency during the year have been set out in section 2 above.